- Difference between before and after exercise
by Chung-Pei Chang

I. Abstract
In clinical practice, we usually use Electrocardiogram (ECG) to show one person in different environment, that way the doctor can know that this happened by ECG. The simplest sample is the rate of ECG, which means the ECG rate can express a person who exercises intense level.
We usually analyze quasi-period signal by neural network, because in neural network, we only use few coefficient to represent these data, and through enough training and database, the network even can analyze the difference between data. ECG is also a kind of quasi-period signal, but as we know, when we training a neural network, we will cost a lot of time and computational cost [1-3].
In signal process, linear prediction coding (LPC) is a kind of signal process, its characteristic is that use in not too long time. In this time, the signal is almost stable. Because of this characteristic, I think this may use on ECG signal process.
II. Introduction of ECG
Electrocardiogram (ECG) is used to describe the potential of heart beat. Because the heart muscles systole regularly, this is an important characteristic, so the heart muscles is the most distinctive muscle in human body. Before systole, the especial conduction system will cause impulses by heart. The impulses can cause myocardium fiber exciting and traction in myocardium. The generation and transmission can arriving whole body. If we can put the electrode at any position on body and connect with ECG instrument correctly, we can get the ECG data.
In ECG data, the most important is these waves, P, Q, R, S and T wave. There are many heart disease by observe these 4 wave's shape or interrelations. P wave means atrium depolarization, QRS wave means ventricle depolarization and T wave means ventricle repolarization (fig1).
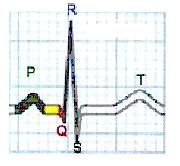
Fig1. A period of ECG signal
III. Flow chart
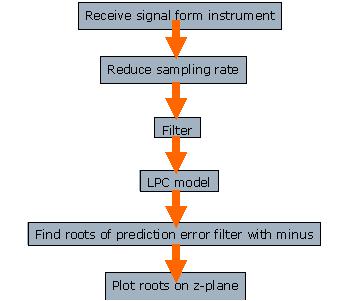
IV. Filter design
Notch filter : 60Hz
Reduce Alternating current form power supply
High pass filter: 2Hz
Reduce Baseline wander
Low pass filter : 45Hz
Reduce Electromyographic (EMG) interference
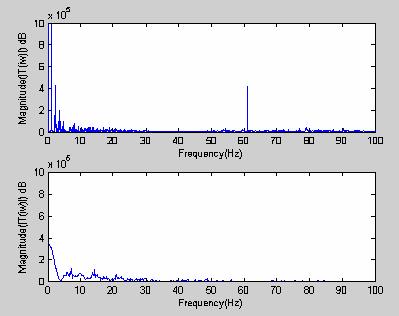
Frequency spectrum: (upper) before filter, (below) after filter
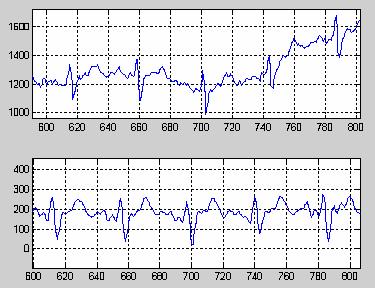
ECG signal: (upper) before filter, (below) after filter
x-axis: mV, y-axis: # of points
As we see, the frequenc spectrum chart, before filter there are noise at about 60Hz, but after filter the noise is disapeared. and after low pass filter, the noise over 45Hz become very small. And because of the high pass filter, the noise below 2Hz also disappear. The another chart, ECG signal before and after filter we can see clearly the base line wander is nuch better, that is used by high pass filter.
V. LPC
After filter, I use signal process method, LPC. That can compression the ECG data, because there are about 250 points in a period of ECG signal, after LPC we can use only some factor to represent the period signal. In LPC, I use 4-kind of order to represent the model. Fig1 shows the coefficient before exercise, and the order is 10. In this figure, there are 4 data, every data I used 3 periods signal. Increase the order to 20 in Fig2, also use 4 data and 12 periods signal. The fig3 and fig4 are show after exercise, order 10 and 20.
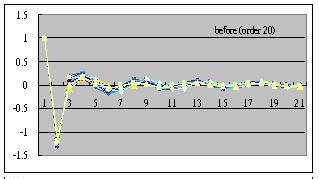
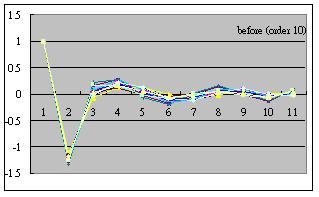
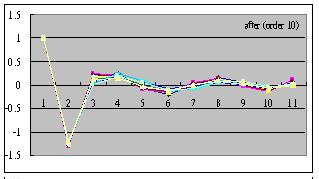
Fig1 before exercise, order 10 Fig2. before exercise, order 20 Fig3. after exercise, oeder 10
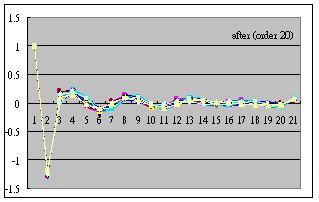
Fig4. after exercise, order 20
In upper figures, weather before or after exercise, the coefficients of LPC are look like the same, if the same order. That can't apart before or after exercise ECG data by using LPC coefficients. In order to make sure this thought, I average the LPC coefficients before and after exercise separately (fig5).
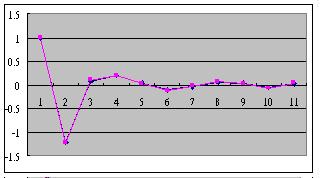
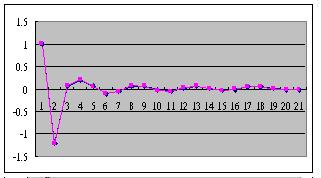
Fig5. average LPC coefficients (left: order 10; right: order 20)
Now, we can sure if we want to part before exercise data or after exercise data, that is impossible. We have to use another way to part these data.
VI. Roots on Z-plane
This is the first way I think (fig11, fig12).
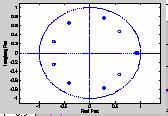
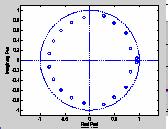
Fig11. (After exercise)the roots of LPC coefficient on z-plane (left: order 10; right: order 20)
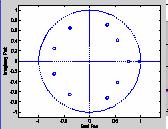
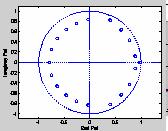
Fig12. (Before exercise) the roots of LPC coefficient on z-plane (left: order 10; right: order 20)
From these two figures, we can find som thing different. That is the center of after exercise the roots of LPC coeficients on Z-plane is origin and the center of after exercise the roots of LPC coeficients on Z-plane is a little right toward origin. In order to make sure this is a real characteristic, I increase the order to 50 (fig13). Now, I can sure this is real characteristic, we can use LPC to find which data is before exercise or after exercise.
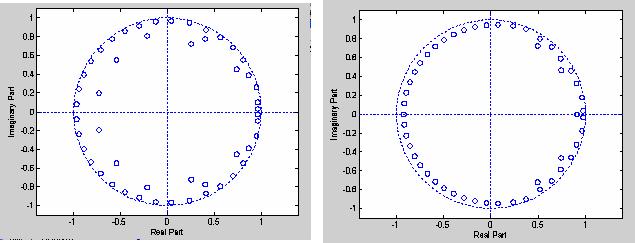
Fig13. The roots of LPC coefficient on z-plane (left: after exercise; reght: before exercise)
VII. Performance
In this project, I calculate performance by root mean square error (table1). From the table, even we increase order to 50, this is a high order, the root mean square error doesn't decrease much. So if we want to decrease the order, in order to decrease computational cost, we have to use another way to find which data is before or after exercise. But if we don't care computational cost, we can increase the order, that way we can find what is different between before and after exercise by naked eye.
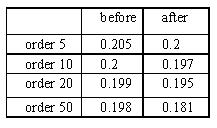
Table1. root mean square error
VIII. Conclusion
First, if we increase the order, there is not much improvement for root mean square error. the root mean square error is about 0.2. Second, the curves before and after exercise after LPC are almost the same. If we use this way, we can't find what is different between before and after exercise. Third, the right figure of fig13 is the roots of before exercise data after LPC, its center is a little right toward origin. And left figure of fig13, this is roots of after exercise data after LPC on Z-plane, the center is almost ar origin.
Reference
[1] Z?mray Dokur, Tamer ?lmez, Ertugrul Yazgan and Okan K. Ersoy, Detection of ECG waveform by neural networks, Med. Eng. Phys. Vol. 19. No. 8, pp.738-741, 1997
[2] Nicos Maglaveras, Telemachos Stamkopoulos, ECG pattern recognition and classification using non-linear transformations and neural networks: A review, International journal of medical Informatics 52 (1998) 191-208
[3] Z?mray Dokur, Tamer ?lmez, ECG beat classification by a novel hybird neural network, computer methods and Programs in Bio. 66 (2001) 167-181
[4] Nora Goldshager, Mervin J. Goldman, Principles of clinical electrocaridography, 1996
[5] Marta Karczewicz, Moncef Gabbouj, ECG data compression by spline approximation, Signal Processing 59 (1997) 43-59